
TKE Serverless 如何对接腾讯云原生 Prometheus 监控?
1. 登录 容器服务控制台,选择左侧导航中的云原生监控。2. 创建监控实例,操作详情请参见 监控实例管理。3. 完成创建后,在“云原生监控”列表页中单击监控实例名称进入监控实例详情页。4. 在监控实例详情页,选择“关联集群”页签。5. 单击关联集群。如下图所示:
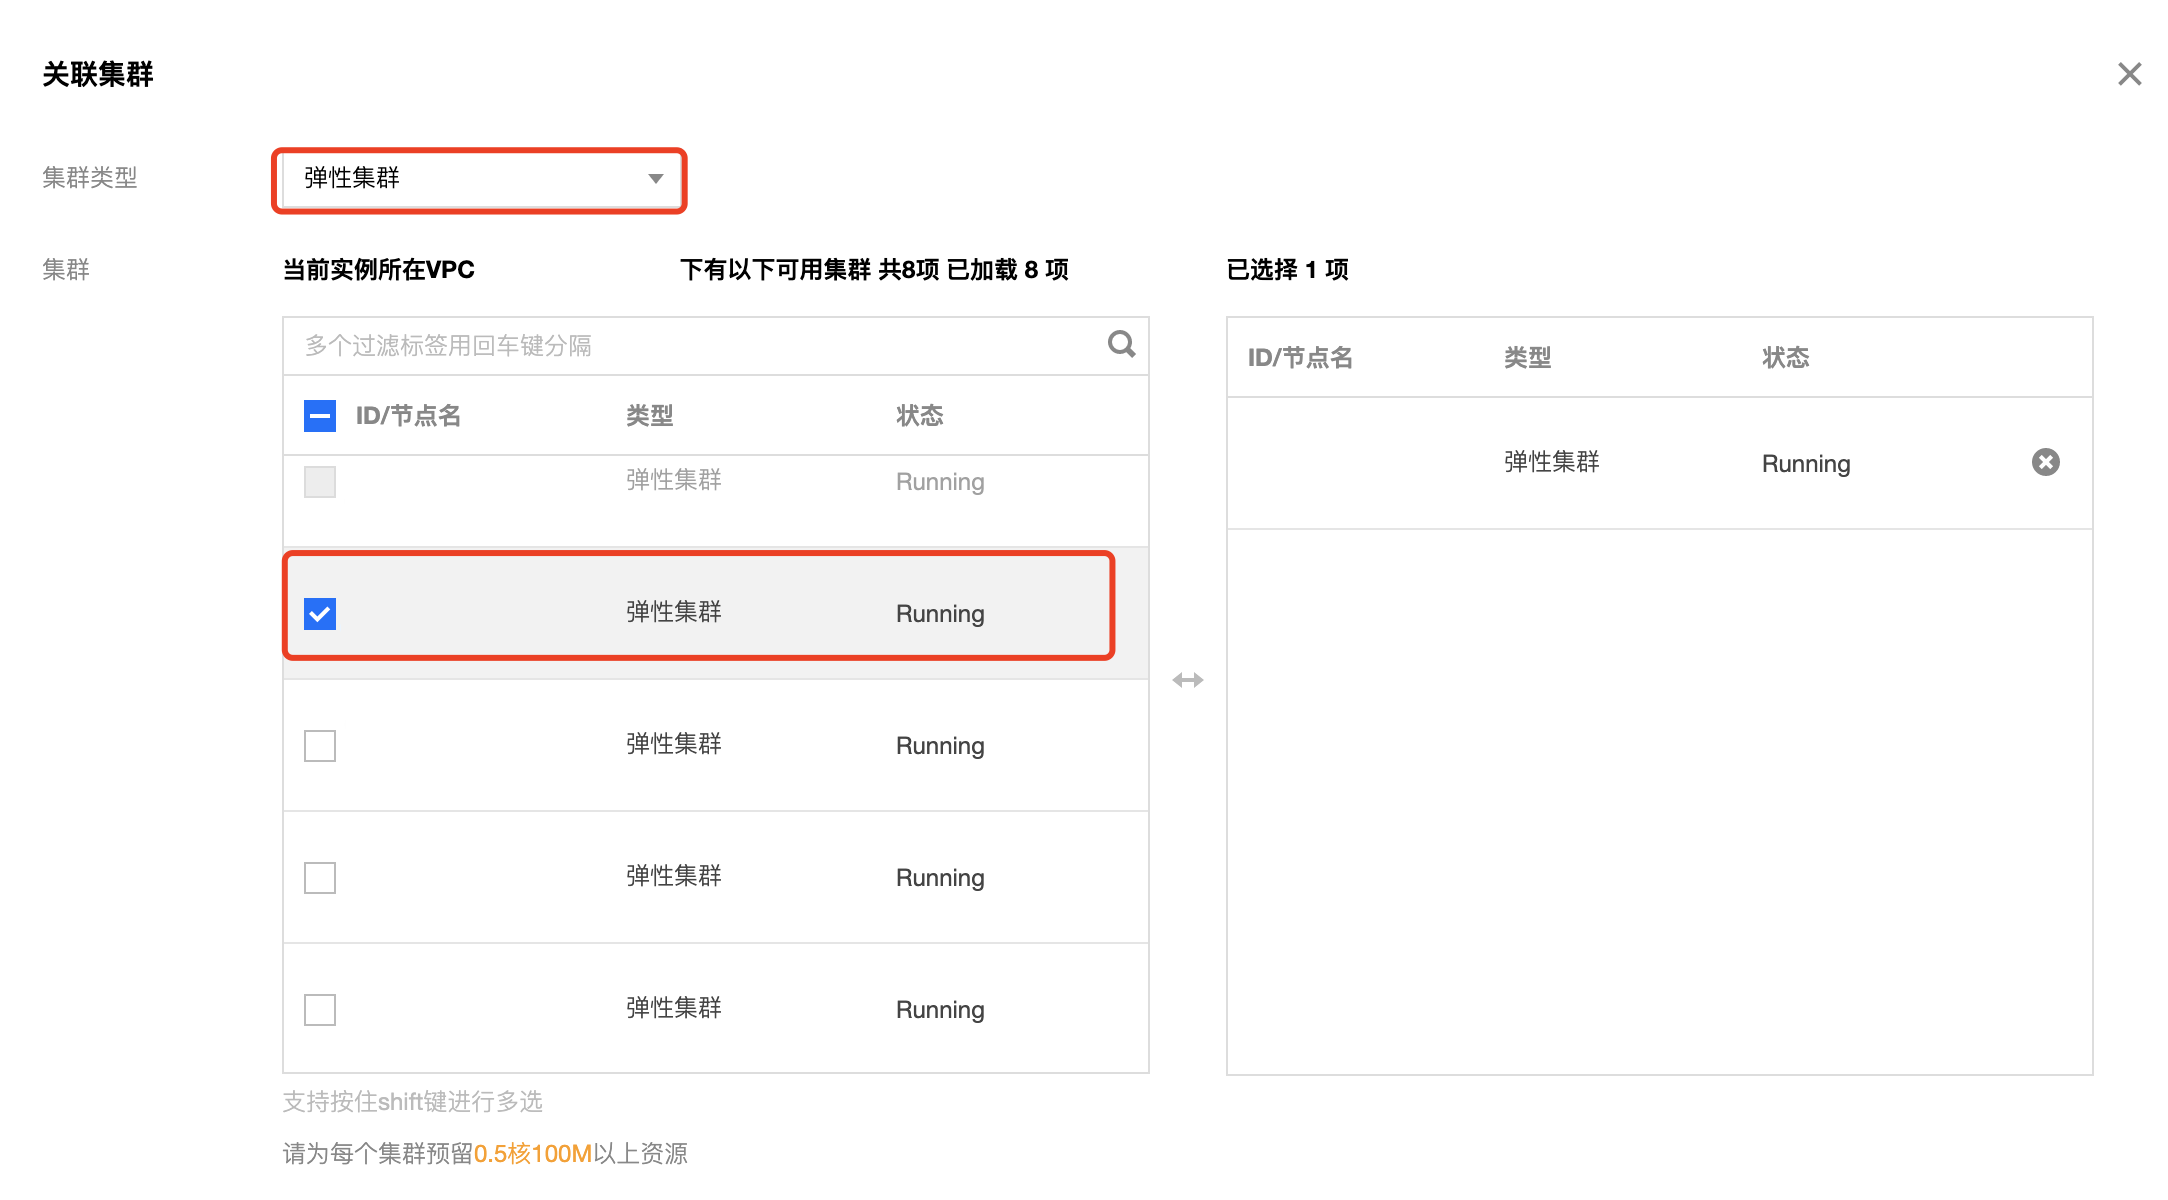

集群类型:选择“弹性集群”。集群:勾选当前 VPC 下需要关联的集群。6. 单击确定完成关联集群。7. 在“关联集群”页签中,单击集群 ID 右侧的数据采集配置,完成数据采集规则配置。操作详情请参见 数据采集配置。8. 在“基本信息”页签中,查看 Grafana 信息。登录指定的 Grafana 地址并输入账号密码即可查看监控数据。
TKE Serverless 如何对接自建 Prometheus?
前提条件
已创建 Prometheus。已安装 Prometheus Operator。已配置 Grafana。在 TKE Serverless 集群中,需要获取以下监控指标:
| 指标类型 | 采集源 | 发现类型 |
| k8s资源指标 | kube-state-metrics | 通过 coredns 访问域名 |
| 容器运行时指标 | pod 的 metrics 接口 | k8s_sd pod 级别 |
监控 k8s 资源指标
若您希望监控 k8s 的资源指标,可以通过在 TKE Serverless 集群内部署 kube-state-metrics 组件及编写 ServiceMonitor 实现。1. 在 TKE Serverless 集群内部署 kube-state-metrics 组件。如果您在 TKE Serverless 的集群内已经部署了 Prometheus Operator 会发现对应的 kube-state-metrics 组件和 node exportor 的 Pod 是 pending 状态,这是因为它们并不适用于 TKE Serverless 集群的场景,node exportor 在 TKE Serverless 集群的监控中不需要使用,可以直接删除该 pod,同时我们需要重新部署kube-state-metrics组件,具体的部署内容如下所示:kube-state-metrics-ClusterRole
apiVersion: rbac.authorization.k8s.io/v1kind: ClusterRolemetadata: labels: app.kubernetes.io/name: kube-state-metrics app.kubernetes.io/version: 1.9.7 name: tke-kube-state-metricsrules: - apiGroups: - "" resources: - configmaps - secrets - nodes - pods - services - resourcequotas - replicationcontrollers - limitranges - persistentvolumeclaims - persistentvolumes - namespaces - endpoints verbs: - list - watch - apiGroups: - extensions resources: - daemonsets - deployments - replicasets - ingresses verbs: - list - watch - apiGroups: - apps resources: - statefulsets - daemonsets - deployments - replicasets verbs: - list - watch - apiGroups: - batch resources: - cronjobs - jobs verbs: - list - watch - apiGroups: - autoscaling resources: - horizontalpodautoscalers verbs: - list - watch - apiGroups: - authentication.k8s.io resources: - tokenreviews verbs: - create - apiGroups: - authorization.k8s.io resources: - subjectaccessreviews verbs: - create - apiGroups: - policy resources: - poddisruptionbudgets verbs: - list - watch - apiGroups: - certificates.k8s.io resources: - certificatesigningrequests verbs: - list - watch - apiGroups: - storage.k8s.io resources: - storageclasses - volumeattachments verbs: - list - watch - apiGroups: - admissionregistration.k8s.io resources: - mutatingwebhookconfigurations - validatingwebhookconfigurations verbs: - list - watch - apiGroups: - networking.k8s.io resources: - networkpolicies verbs: - list - watch - apiGroups: - coordination.k8s.io resources: - leases verbs: - list - watch
kube-state-metrics-service-ClusterRoleBinding
apiVersion: rbac.authorization.k8s.io/v1kind: ClusterRoleBindingmetadata: labels: app.kubernetes.io/name: kube-state-metrics app.kubernetes.io/version: 1.9.7 name: tke-kube-state-metricsroleRef: apiGroup: rbac.authorization.k8s.io kind: ClusterRole name: tke-kube-state-metricssubjects: - kind: ServiceAccount name: tke-kube-state-metrics namespace: kube-system
kube-state-metrics-deployment
apiVersion: apps/v1kind: Deploymentmetadata: labels: app.kubernetes.io/name: kube-state-metrics app.kubernetes.io/version: 1.9.7 name: tke-kube-state-metrics namespace: kube-systemspec: replicas: 1 selector: matchLabels: app.kubernetes.io/name: kube-state-metrics template: metadata: labels: app.kubernetes.io/name: kube-state-metrics app.kubernetes.io/version: 1.9.7 spec: containers: - image: ccr.ccs.tencentyun.com/tkeimages/kube-state-metrics:v1.9.7 livenessProbe: httpGet: path: /healthz port: 8080 initialDelaySeconds: 5 timeoutSeconds: 5 name: kube-state-metrics ports: - containerPort: 8080 name: http-metrics - containerPort: 8081 name: telemetry readinessProbe: httpGet: path: / port: 8081 initialDelaySeconds: 5 timeoutSeconds: 5 securityContext: runAsUser: 65534 serviceAccountName: tke-kube-state-metrics
kube-state-metrics-service
apiVersion: v1kind: Servicemetadata: labels: app.kubernetes.io/name: kube-state-metrics app.kubernetes.io/version: 1.9.7 name: tke-kube-state-metrics namespace: kube-systemspec: clusterIP: None ports: - name: http-metrics port: 8180 targetPort: http-metrics - name: telemetry port: 8181 targetPort: telemetry selector: app.kubernetes.io/name: kube-state-metrics
kube-state-metrics-serviceaccount
apiVersion: v1kind: ServiceAccountmetadata: labels: app.kubernetes.io/name: kube-state-metrics app.kubernetes.io/version: 1.9.7 name: tke-kube-state-metrics namespace: kube-system
2. 在 TKE Serverless 集群内部署 ServiceMonitor。
ServiceMonitor 可以定义如何监控一组动态服务,部署 kube-state-metrics-servicemonitor 后,Prometheus 可以通过 kube-state-metrics 来收集 k8s 的资源指标。具体的部署内容如下所示:kube-state-metrics-servicemonitor
apiVersion: monitoring.coreos.com/v1kind: ServiceMonitormetadata: labels: app.kubernetes.io/name: kube-state-metrics app.kubernetes.io/version: 1.9.7 name: kube-state-metrics namespace: kube-systemspec: endpoints: - interval: 15s port: http-metrics scrapeTimeout: 15s honorLabels: true jobLabel: app.kubernetes.io/name selector: matchLabels: app.kubernetes.io/name: kube-state-metrics
监控容器运行时指标
TKE Serverless 中的 Pod 通过暴露9100端口向外提供监控数据,您可以通过访问 podip:9100/metrics 获取监控数据指标。相较于容器服务 TKE 标准的监控配置,监控 TKE Serverless 需要修改相应的配置文件,建议使用 Operator 的 additional scrape config 配置。此外,您也可以通过在 Pod 中添加 annotation 的方式对指定的 Pod 进行监控。1. 通过配置 Operator 的 additional\sscrape\sconfig 获取监控数据指标。若您希望通过访问 podip:9100/metrics 获取监控数据指标,可执行以下步骤:1.1 新建 prometheus-additional.yaml 文件。1.2 在文件中添加 scrape_configs。scrape_configs 内容如下所示:
- job_name: eks-info honor_timestamps: true metrics_path: /metrics scheme: http kubernetes_sd_configs: - role: pod bearer_token_file: /var/run/secrets/kubernetes.io/serviceaccount/token tls_config: insecure_skip_verify: true relabel_configs: - source_labels: [__meta_kubernetes_pod_ip] separator: ; regex: (.*) target_label: __address__ replacement: ${1}:9100 action: replace - source_labels: [__meta_kubernetes_pod_name] separator: ; regex: (.*) target_label: pod_name replacement: ${1} action: replace metric_relabel_configs: - source_labels: [__name__] separator: ; regex: node_network_receive_packets_total target_label: __name__ replacement: container_network_receive_packets_total action: replace - source_labels: [__name__] separator: ; regex: node_network_receive_bytes_total target_label: __name__ replacement: container_network_receive_bytes_total action: replace - source_labels: [__name__] separator: ; regex: node_network_transmit_bytes_total target_label: __name__ replacement: container_network_transmit_bytes_total action: replace - source_labels: [__name__] separator: ; regex: node_network_transmit_packets_total target_label: __name__ replacement: container_network_transmit_packets_total action: replace - source_labels: [pod_name] separator: ; regex: (.*) target_label: pod replacement: $1 action: replace - source_labels: [__name__] separator: ; regex: (container_network.*|pod_.*) replacement: $1 action: keep - separator: ; regex: pod_name|node|unInstanceId|workload_kind|workload_name replacement: $1 action: labeldrop
1.3 完成部署后,连接 Grafana 获取相应数据。2. 通过在 Pod 中添加 annotation 对指定 Pod 进行监控。
若您希望通过在 Pod 中添加 annotation 的方式对指定的 Pod 进行监控,可执行以下步骤:2.1 修改需要进行采集的 Pod 的 yaml 文件,在 spec.template.metadata.annotations 中配置以下内容:
prometheus.io/scrape: 'true'prometheus.io/port: '9100'prometheus.io/path: 'metrics'
2.2 配置 scrape_configs。配置 scrape_configs 后,prometheus 会对所有配置过采集信息为 true 的 Pod 进行监控。scrape_configs 请参考以下配置:
- job_name: kubernetes-pods honor_timestamps: true metrics_path: /metrics scheme: http kubernetes_sd_configs: - role: pod relabel_configs: - source_labels: [__meta_kubernetes_pod_annotation_prometheus_io_scrape] separator: ; regex: "true" replacement: $1 action: keep - source_labels: [__meta_kubernetes_pod_annotation_prometheus_io_path] separator: ; regex: (.+) target_label: __metrics_path__ replacement: $1 action: replace - source_labels: [__address__, __meta_kubernetes_pod_annotation_prometheus_io_port] separator: ; regex: ([^:]+)(?::\d+)?;(\d+) target_label: __address__ replacement: $1:$2 action: replace - separator: ; regex: __meta_kubernetes_pod_label_(.+) replacement: $1 action: labelmap - source_labels: [__meta_kubernetes_namespace] separator: ; regex: (.*) target_label: kubernetes_namespace replacement: $1 action: replace - source_labels: [__meta_kubernetes_pod_name] separator: ; regex: (.*) target_label: kubernetes_pod_name replacement: $1 action: replace
自建 Prometheus 如何迁移到腾讯云原生监控服务?
若您需要将自建的 Prometheus 迁移至腾讯云原生监控服务,可参见 自建 Prometheus 迁移到云原生监控。
容器服务官网1折活动,限时活动,即将结束,速速收藏
同尘科技为腾讯云授权服务中心。
购买腾讯云产品享受折上折,更有现金返利。同意关联立享优惠
转转请注明出处:http://www.yunxiaoer.com/148889.html